Note
Go to the end to download the full example code.
Read pridb
Open pridb
pridb = vae.io.PriDatabase(PRIDB)

print("Tables in database: ", pridb.tables())
print("Number of rows in data table (ae_data): ", pridb.rows())
print("Set of all channels: ", pridb.channel())
Tables in database:  {'ae_markers', 'ae_params', 'acq_setup', 'ae_globalinfo', 'ae_data', 'ae_fieldinfo', 'data_integrity'}
Number of rows in data table (ae_data):  18
Set of all channels:  {1, 2, 3, 4}
Read hits to Pandas DataFrame
Hits:   0%|          | 0/4 [00:00<?, ?it/s]
Hits: 100%|██████████| 4/4 [00:00<00:00, 12623.94it/s]
            time  channel  amplitude  counts        energy
set_id
10      3.992771        3   0.046539    2180  2.799510e+07
11      3.992775        2   0.059621    2047  2.276279e+07
12      3.992813        4   0.034119    1854  1.286700e+07
13      3.992814        1   0.029115    1985  1.265275e+07
Query Pandas DataFrame
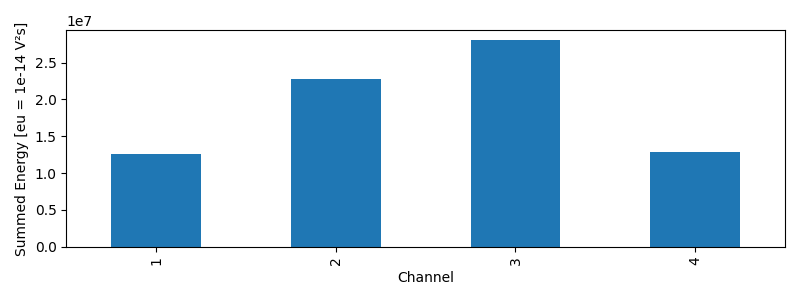
DataFrames offer powerful features to query and aggregate data, e.g. plot summed energy per channel
ax = df_hits.groupby("channel").sum()["energy"].plot.bar(figsize=(8, 3))
ax.set_xlabel("Channel")
ax.set_ylabel("Summed Energy [eu = 1e-14 V²s]")
plt.tight_layout()
plt.show()
Read markers
df_markers = pridb.read_markers()
print(df_markers)
Marker:   0%|          | 0/5 [00:00<?, ?it/s]
Marker: 100%|██████████| 5/5 [00:00<00:00, 34155.57it/s]
          time  set_type                                        data  number
set_id
1         0.00         6                                                   1
2         0.00         4                                10:52 Resume       1
3         0.00         5                         2019-09-20 10:54:52    <NA>
4         0.00         4  TimeZone: +02:00 (W. Europe Standard Time)       2
18      100.07         4                               10:56 Suspend       3
Read parametric data
df_parametric = pridb.read_parametric()
print(df_parametric)
Parametric:   0%|          | 0/9 [00:00<?, ?it/s]
Parametric: 100%|██████████| 9/9 [00:00<00:00, 43640.16it/s]
        time  param_id  status  pctd  pcta
set_id
5       0.00         1      12     0     0
6       1.00         1      12     0     0
7       2.00         1      12     0     0
8       3.00         1      12     0     0
9       3.99         1      12     0     0
14      4.00         1      12     0     0
15      5.00         1      12     0     0
16      6.00         1      12     0     0
17      6.45         1       0     0     0
Total running time of the script: (0 minutes 0.142 seconds)