Note
Go to the end to download the full example code.
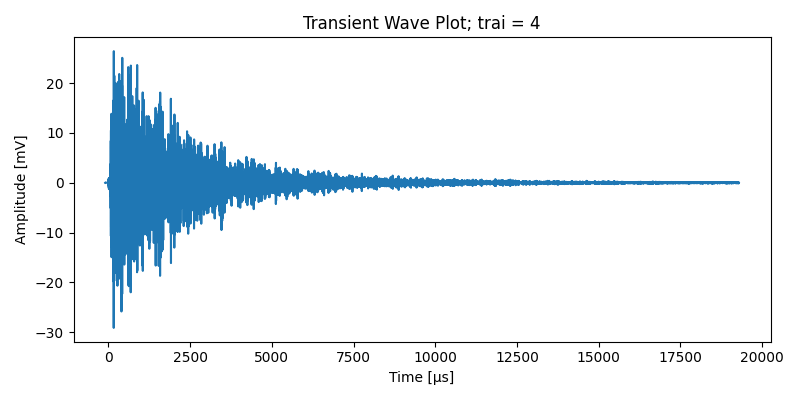
Read and plot transient data
from pathlib import Path

import matplotlib.pyplot as plt

import vallenae as vae

HERE = Path(__file__).parent if "__file__" in locals() else Path.cwd()
TRADB = HERE / "steel_plate" / "sample_plain.tradb"  # uncompressed
TRAI = 4  # just an example, no magic here


def main():
    # Read waveform from tradb
    with vae.io.TraDatabase(TRADB) as tradb:
        y, t = tradb.read_wave(TRAI)

    y *= 1e3  # in mV
    t *= 1e6  # for µs

    # Plot waveforms
    plt.figure(figsize=(8, 4), tight_layout=True)
    plt.plot(t, y)
    plt.xlabel("Time [µs]")
    plt.ylabel("Amplitude [mV]")
    plt.title(f"Transient Wave Plot; trai = {TRAI}")
    plt.show()


if __name__ == "__main__":
    main()
Total running time of the script: (0 minutes 0.141 seconds)